Stream 3 Flood Risk Prediction - Hackathon Activity Log
Workstream Goal
Risk Classification – Overlay forecasts with flood hazard maps using imagery and algorithms from Digital Earth Africa.
Approach
-
Exploring DSM & DTM:
- Digital Surface Model: ESA Copernicus glo 30 (this is technically a surface model,not terrain model)
- Digital Terrain Model: DeltaDTM v1.1
- but no river data in deltadtm, so need to either merge in w/. copernicus, or fill na’s.
-
Modelling:
- working to create hand model, which can be useful with riverine flooding (not necessarily coastal flooding or flash floods). HAND
- starting with hydro condition of models: filling pits to make sure flow doesn’t just pool falsely, breaching, etc. to create hydro conditioned DTM.
- then compute streams from DTM and select only mainstem streams.
- then finally a HAND raster. this can be linked to river gauge readings to estimate flood based on terrain.
- getting building footprints from HOTOSM. Doesn’t have attributes we want, looking for category (single family house, residential…and maybe height), so will keep looking for alternatives.
- the settlement detection and classification map from Stream 1 is useful, can these be created for the future as well, in addition to the probability map? those could be used in looking at the flood risk areas and settlements which could be inundated
-
Scripting
- creating local python script which can be read into a notebook
- extracting data for the flood event (all data from April 2022):
- Normalized Difference Flood Index (NDFI) from sentinel2 or landsat - or, what ever is available in the Digital Earth Africa.
- MNDWI (Modified NDWI). For the NDFI and MNDWI indices we used Landsat-8 30m image from 14th April 2022.
- Sentinel-1 SAR data (C-band, 10 m resolution, ~6–12 days revisit) from 2022-04-05 to 2022-04-17, acquired from the DEA sandbox using its tools.
- pushed data to https://github.com/NickKellett/hackathon-g20-drr/tree/main/3_flood_risk/data_for_analysis
- Pushed new code and html maps to github. The data created from the scripts is also uploaded: data outputs are in the Durban folder, code in src.
-
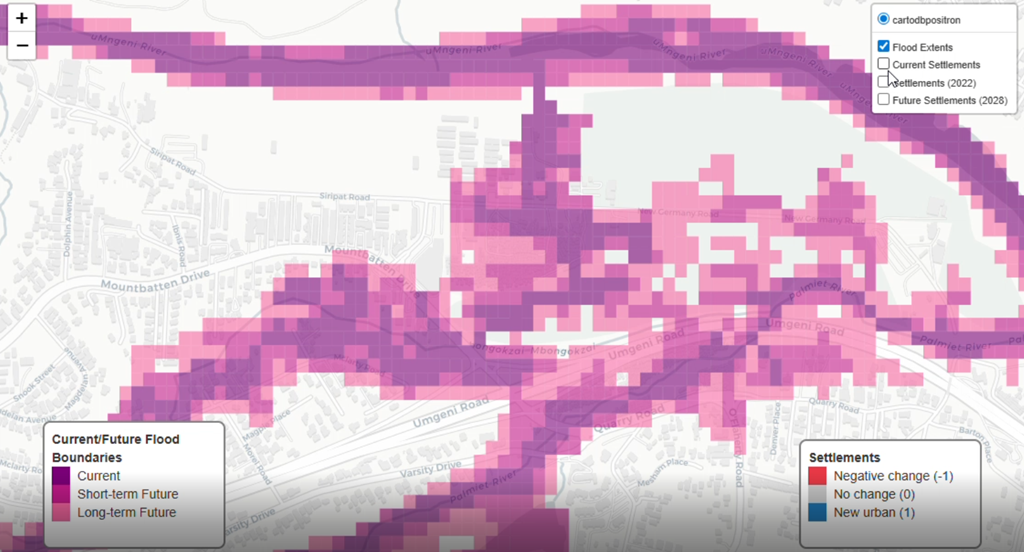
Flood extents prediction map:
-
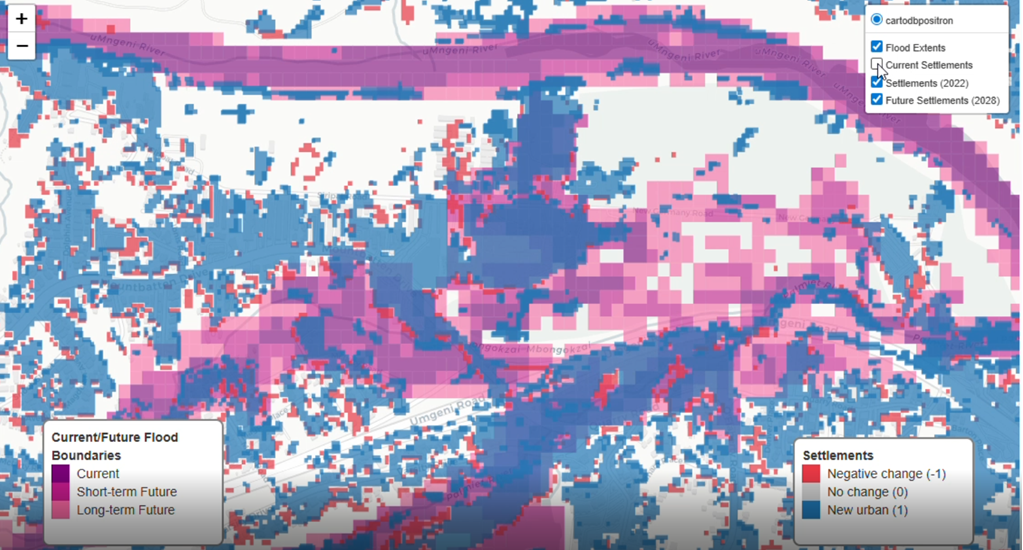
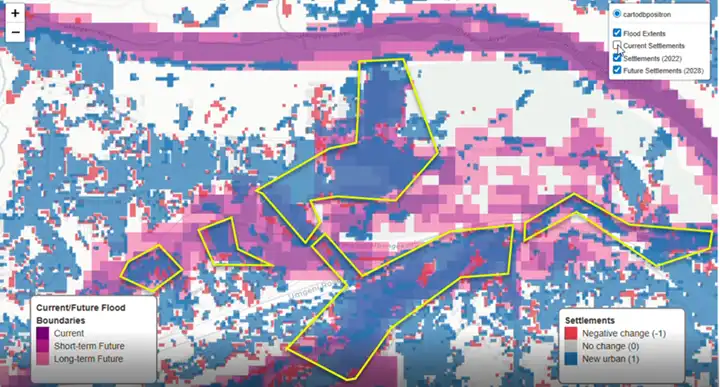
Flood risk prediction map (extents with current and potential future settlement overlay):
-
Below we have manually added callouts to make it easier to spot areas that could be potential flood risks under current and future settlement growth scenarios.
-
Evacuation Sites
- Find safe areas: It reads a flood map and identifies dry land by converting safe (non-flooded) areas into polygons. split these polygons into 100 individual polygons.
- Check road access: It keeps only those dry areas that are close enough to roads, making sure people can reach them.
- Filter by elevation: It removes sites that are too low, keeping only those above a certain elevation to avoid future flooding.
- Check proximity to services: It further filters sites to make sure they are near important services like hospitals and parks.
- Score sites: It ranks the remaining sites based on how close they are to these services.
- Save results: The final list of ideal evacuation sites is saved as a GeoJSON file for use in maps or other tools.
Related reading
- View the Flood Risk detailed results.