Stream 2 Settlement Growth Prediction - Hackathon Activity Log
Workstream Goal
Forecast Expansion – Predict development over 1–3 years using imagery and algorithms from Digital Earth Africa.
Approach
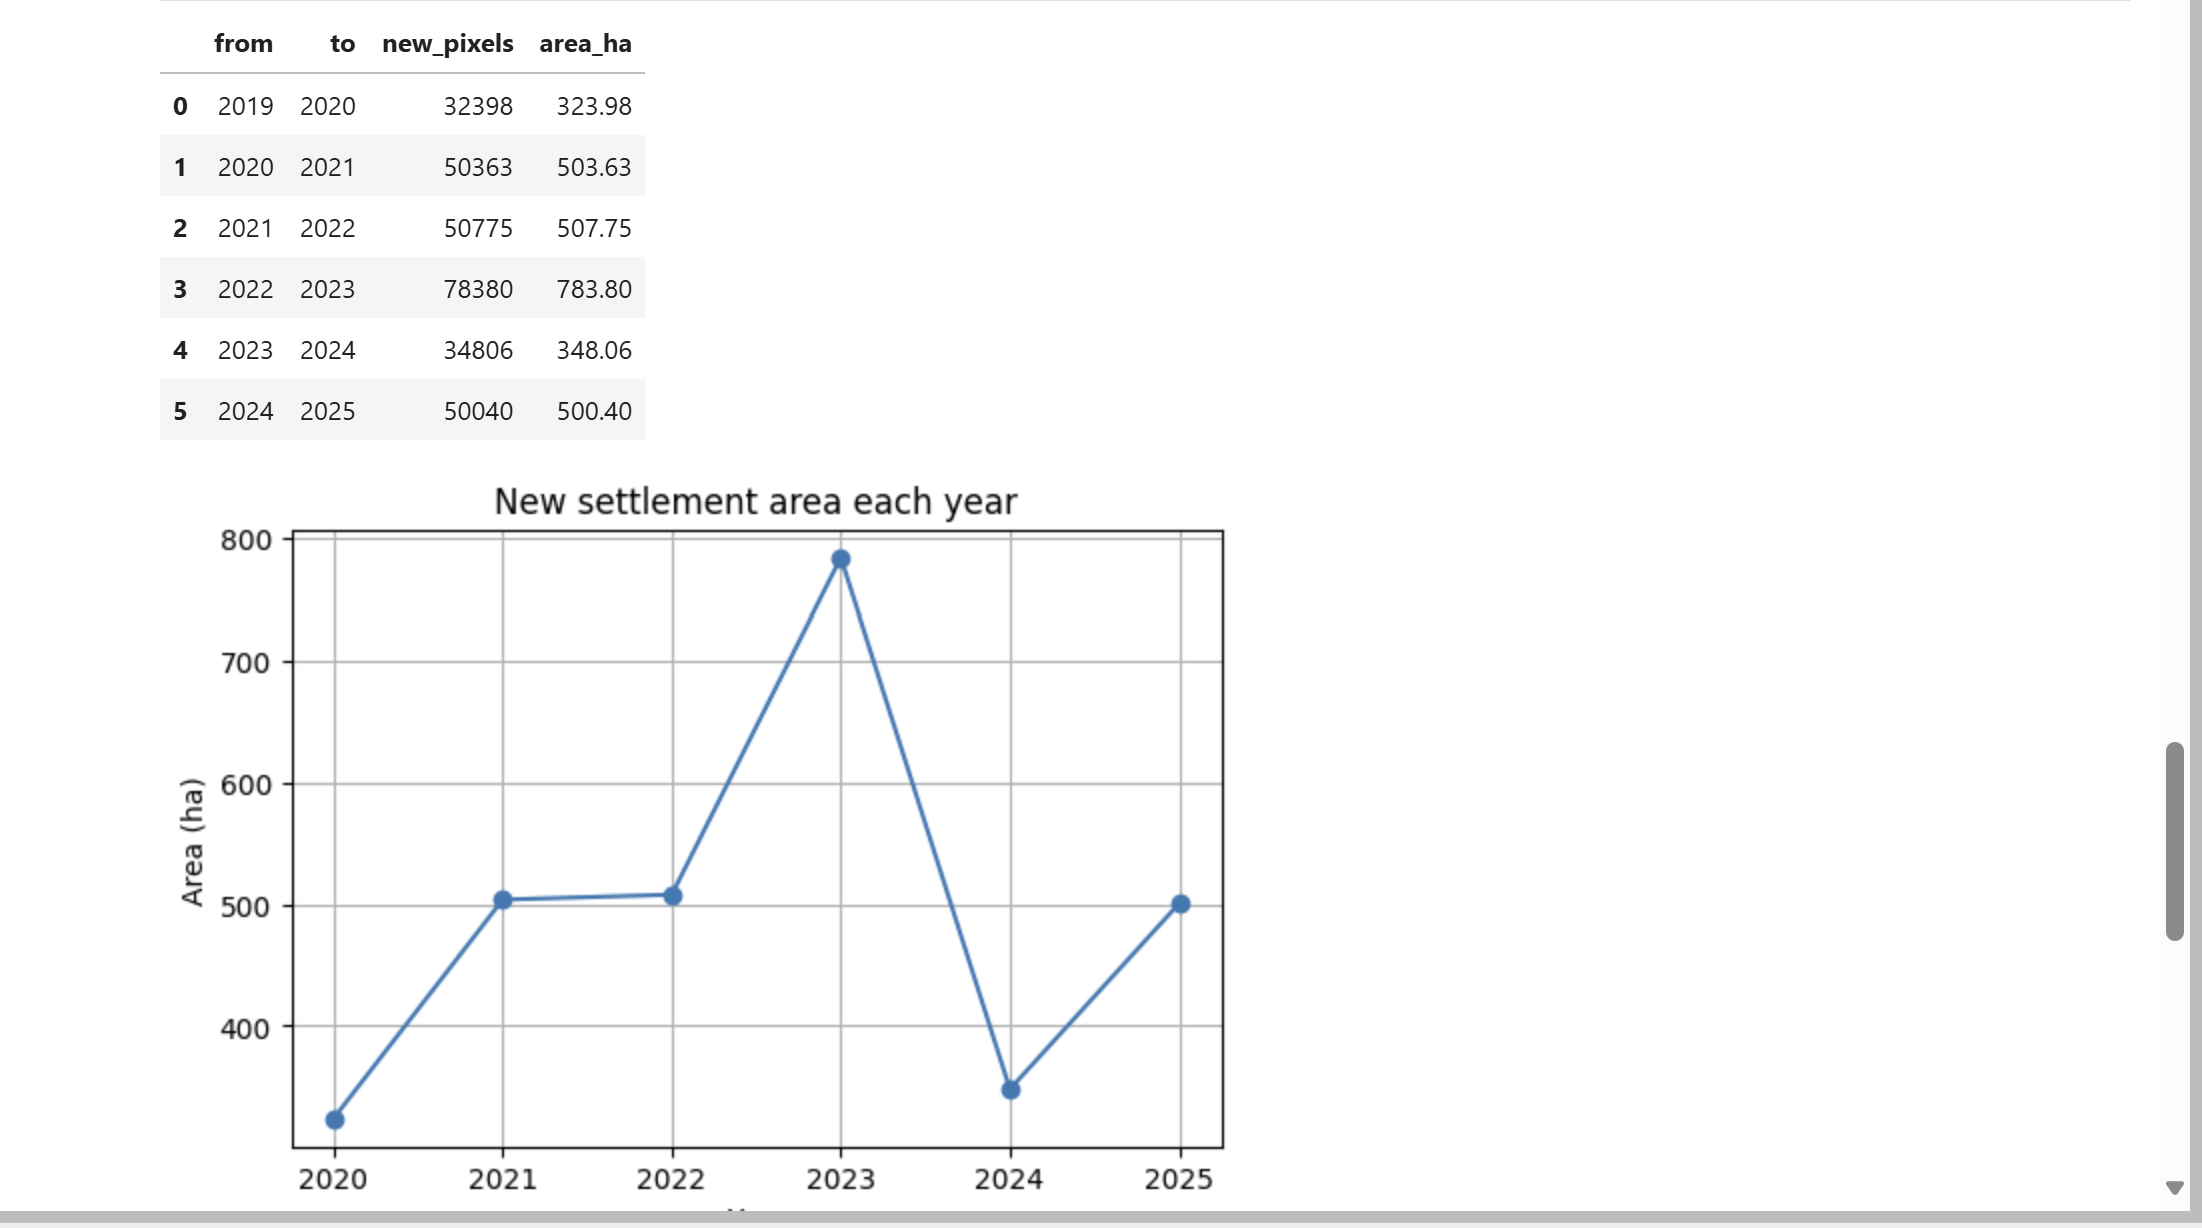
- We processed the change maps (2019–2025) and computed annual new settlement growth.
- Growth varies year to year, but averages around 500 ha per year, with a big spike in 2022→23 (780 ha). Plot shows the trend:
- Why the drop from 2023 to 2024? Some possibilities:
- people might have relocated after the flood event in 2022
- threshold method didn’t work out well enough
- We did the following to prevent the unusual year distorting the results:
- Keep the raw yearly numbers for context, but
- Fit a linear trend to smooth the growth pattern, and
- Use that to generate forecasts for 2026–2028.
- This way our projections are more stable and reliable for overlaying with the flood risk maps.
- Issue: after the event in 2022, the river changed its color and now is detected as urban area, it can contribute to extra settlement pixels.
- Initially did not consider the event that happened in 2022, instead of considering the before and the after periods in 2022. Now when considering before and after periods in 2022:
- revised growth plot:

- data was showing new settlement growth per year from 2019 up to 2025, but the x-axis is aligned to the ending year/event.
- That is why the first point is 2020, because it represents change from 2019 to 2020. Nothing flows into 2019 since it is the baseline.
- In 2022, things split: 2022_before shows growth leading up to the flood event. 2022_event shows the spike caused by the flood misclassification (the river being detected as settlement).
- After that, the trend goes back to “normal” with 2023, 2024, and 2025.
- As already established, The apparent jump in 2022_event is not natural growth, but is likely to be an artifact of the flood changing the river’s appearance in the imagery. That is why it peaks unusually high. The drop in 2024 shows much less new growth that year, then it rises again in 2025.
- With the revised approach there is no need to fit the regression line anymore.
- revised growth plot:
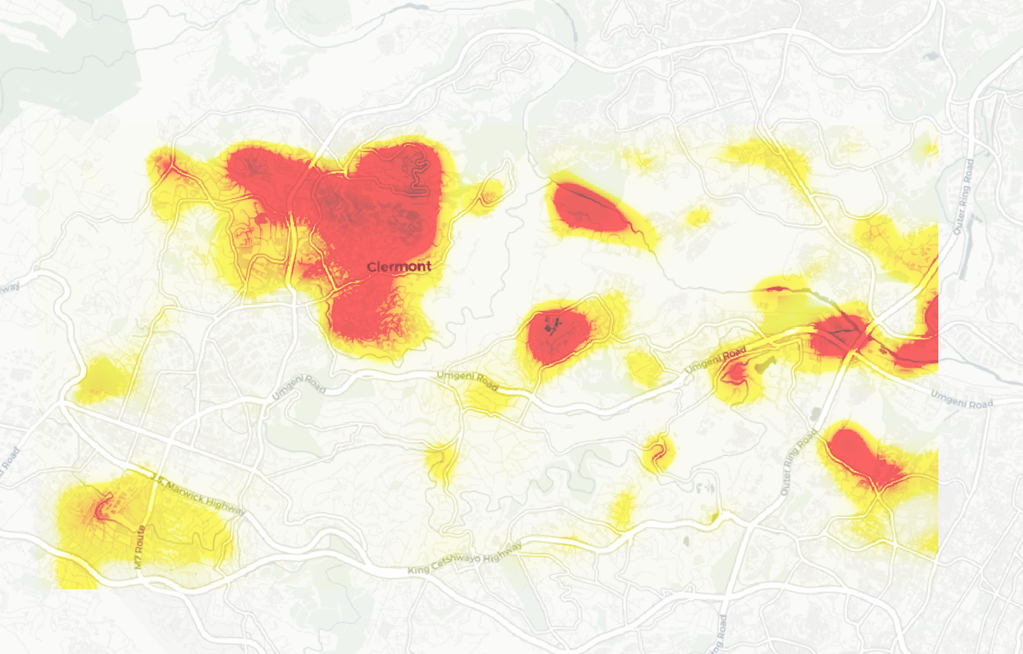
- Here is the hotspot probability map generated for 2022–2025. We did not include the preceding years because their changes were minimal.
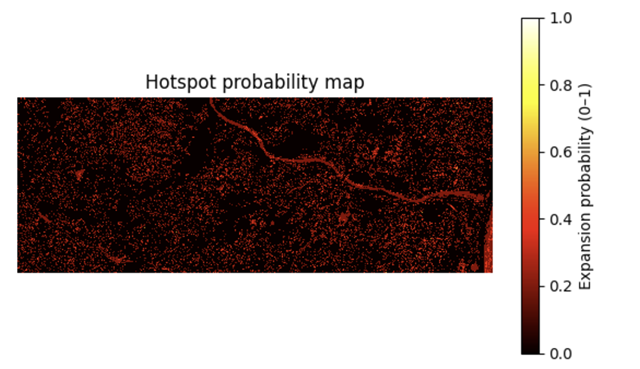
- The heat map is a good way to summarize the growth areas spatially.
- It shows areas with consistent settlement expansion, the brighter the color, the higher the probability of growth. Notice the river also shows up, that is because of the 2022 flood event, which altered its spectral signature and got picked up as change. This highlights how sensitive the analysis is to environmental events.
- We needed to split the growth forecasts into two scenarios because the 2022 flood was a unique event, it caused a sharp drop in settlement expansion that does not follow the natural trend. If we forced all years into one model, the results would either ignore the flood’s impact or distort the forecast with unrealistic negative growth, as we initially saw.
- Growth Forecast Scenarios:
- Flood-aware (Scenario A): captures the disruption; useful to show what happens if floods continue to shape expansion.
- Flood-free (Scenario B): removes the anomaly; useful to show the “natural” growth path without disasters.
- Related, our findings clearly indicate two distinct futures:
- Flooding is a strong disrupter of settlement growth and changes (see also Flood Risk Results).
- Better adaptation and resilience measures are in place (see also Policy, Awareness & Outreach Results).
- We also compared the 2025 observed TIFF with the forecast. While the growth is not major, it is visible.
- We uploaded the forecast in GeoTIFF format, each scenario has three outcomes (2026–2028). These should help with the flood overlays.
- What we plan on doing next is making the forecast visualizations more appealing.
- Restarting the work with the updated detection data, and will use the CA - Markov in QGIS to do the prediction now.
- As suggested earlier, instead of just assuming the growth to be random , we am putting in some constraints like roads, water bodies, slope etc. These are the datasets already available on git that’s going to be helpful to me.
- Refined binary settlement maps.
- Change maps (useful for validation).
- LULC maps.
- Flood data: Sentinel-1 and Landsat-derived water indices (MNDWI, NDFI).
- Hydro-conditioned DTM (final_hydro_conditioned_masked.tif).
- We need the boundary data as well
- We used the DTM provided to generate the slope and also the MNDWI for water mask
- We tried generating rasters from road shapefiles but the min max values we are getting getting ( 1 and 1) might interfere with the distance generation.
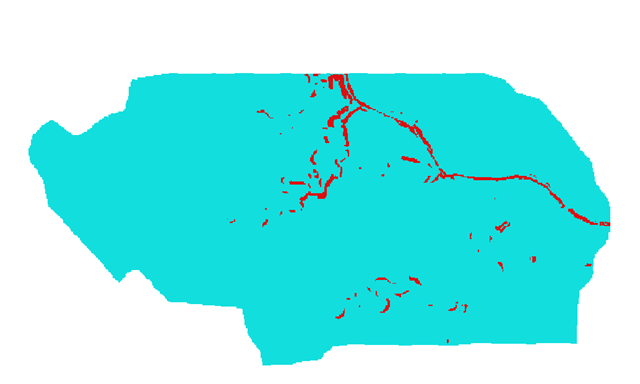
- We built a slope mask (restricted slopes >30°) and combined it with the water mask from MNDWI. The result is our final constraint layer to feed into MOLUSCE showing only areas potentially suitable for settlement growth. BLUE marks an area available for settlement and RED shows the presence of geographic constraints that would likely prevent settlement.
- Note this does not incorporate any private or government land or other land use constraints.
- We generated three outputs which give us both the past trend and the future projection. The range is between 1 and -1 so they can be reclassified or symbolized to show gain, no gain and then loss:
- The 2019 → 2025 change map, showing how settlements actually evolved.
- The growth map leading into 2028, capturing expansion over the 3-year window.
- The 2025 → 2028 change map, which is our forecasted growth.
- We created two maps. One has a side by side comparison of the growths and the other one the total estimated growth on ground by 2028. There’s also a pdf of of my validation results.